Debugging JavaScript doesn’t have to be overwhelming. Chrome DevTools provides a built-in set of tools to help you identify and fix issues in your code. Here’s what you need to know to get started:
- Why Chrome DevTools? It offers features like real-time error tracking, performance monitoring, and the ability to edit pages directly in the browser.
- Key Features: Use the Sources panel for setting breakpoints, the Console for testing code, and the Network panel for analyzing requests.
- How to Open DevTools: Use shortcuts like
F12orCtrl+Shift+I(Windows/Linux) andCmd+Option+I(Mac), or access it through Chrome’s menu. - Debugging Tools: Breakpoints, DOM monitoring, variable inspection, and network throttling are just some of the tools available.
- Advanced Tips: You can filter out third-party scripts, set conditional breakpoints, or use logpoints to track behavior without stopping code execution.
Chrome DevTools is a powerful resource for debugging JavaScript efficiently. Whether you’re troubleshooting errors, analyzing performance, or testing fixes, these tools simplify the process and improve your workflow.
Debugging JavaScript – Chrome DevTools 101
How to Access and Navigate Chrome DevTools
Getting started with Chrome DevTools is straightforward, and there are several ways to open and navigate this powerful tool. Let’s break it down step by step.
How to Open Chrome DevTools
You can open Chrome DevTools using keyboard shortcuts, Chrome’s menu, or even command-line flags. The fastest method? Keyboard shortcuts. Here’s a quick reference based on your operating system:
| OS | Open Elements Panel | Open Console Panel | Open Last Panel Used |
|---|---|---|---|
| Windows/Linux | Ctrl + Shift + C | Ctrl + Shift + J | F12 or Ctrl + Shift + I |
| Mac | Cmd + Option + C | Cmd + Option + J | Fn + F12 or Cmd + Option + I |
If shortcuts aren’t your thing, you can also access DevTools through Chrome’s menu. Just click the three vertical dots in the top-right corner, go to More Tools, and select Developer Tools. This will open the last panel you used.
Want DevTools to open automatically on every tab? Use the command line with the --auto-open-devtools-for-tabs flag. Here’s how:
- macOS:
open -a "Google Chrome" --args --auto-open-devtools-for-tabs - Windows:
start chrome --auto-open-devtools-for-tabs - Linux:
google-chrome --auto-open-devtools-for-tabs
Once you’ve opened DevTools, it’s time to explore its interface and panels.
DevTools Interface Overview
Chrome DevTools is divided into several panels, each tailored for a specific development or debugging task. Here’s a snapshot of the key panels:
- Elements panel: Lets you inspect and tweak HTML and CSS in real time.
- Console panel: Your go-to spot for JavaScript. You can view error messages, test snippets of code, or run commands interactively.
- Sources panel: Ideal for JavaScript debugging. Set breakpoints, step through your code, and inspect variables. Enable source maps (Settings > Preferences > Sources) to make debugging minified files easier.
- Network panel: Tracks network requests, which is invaluable for debugging AJAX calls and analyzing load performance.
- Performance panel: Records runtime metrics and helps identify JavaScript bottlenecks.
- Memory panel: Monitors memory usage and identifies leaks, especially useful for apps dealing with large datasets or running long-term.
- Application panel: Gives access to client-side storage like
localStorage,sessionStorage, cookies, and service workers. - Security panel: Focuses on your app’s security, including HTTPS setup and certificate checks.
Each panel serves a unique purpose, so knowing when and how to use them is key to efficient debugging.
Adjusting the DevTools Layout
Customizing the layout of Chrome DevTools can make your workflow much smoother. You can dock the tool to the bottom, the right side of the browser, or even undock it into a separate window. Here’s how to decide:
- Bottom dock: Best for wide screens, giving you a broader horizontal view.
- Right-side dock: Ideal for narrower screens or when you need more vertical space.
- Undocked window: Perfect for multitasking across multiple monitors.
To adjust the layout, click the three-dot menu in the top-right corner of the DevTools window. You can also rearrange panels by dragging their tabs or move secondary panels to the drawer at the bottom. Open the drawer by pressing the Escape key while DevTools is active. This gives you quick access to tools like the Console and other specialized debugging utilities.
For JavaScript debugging, prioritize the Sources and Console panels. If you’re working on responsive design, make the Elements panel your main focus. Tailoring the layout to your needs will save time and make debugging far more efficient.
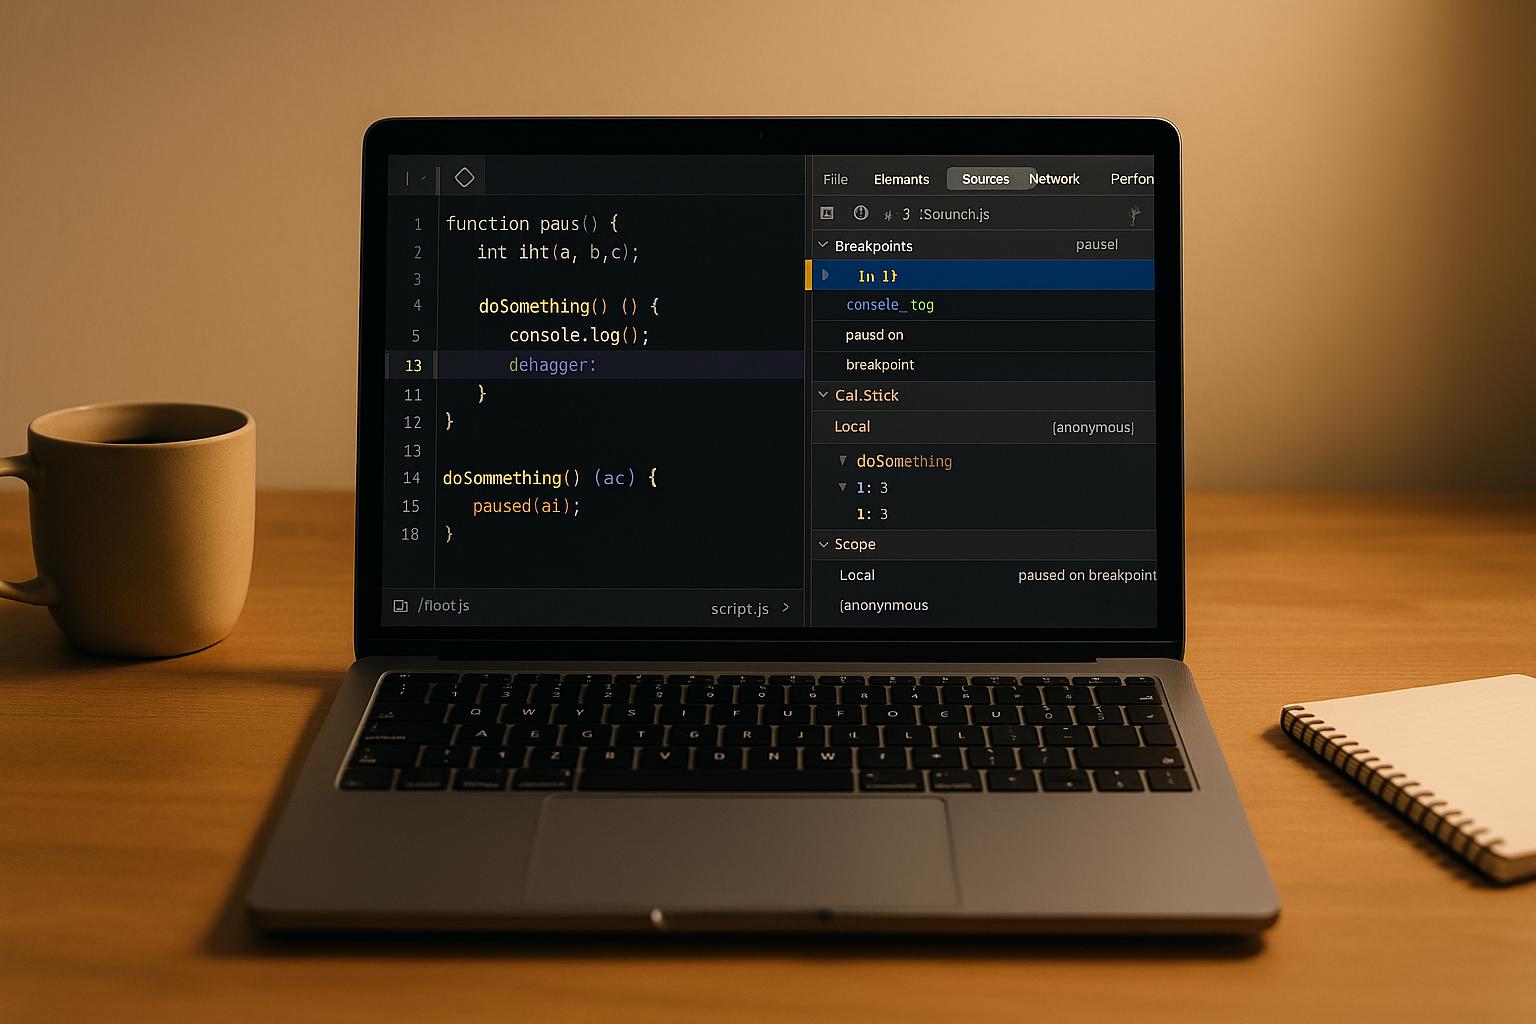
How to Use Breakpoints for Debugging
Breakpoints are an essential tool for debugging. They let you pause your code at specific points, giving you the chance to inspect variables, review the call stack, and figure out exactly what’s going on in your application. Essentially, breakpoints put you in control of your code’s execution flow.
Setting Up and Managing Breakpoints
To set a breakpoint, click on the line number in the Sources panel or add a debugger; statement directly in your code. If the breakpoint is active, you’ll see a blue icon next to it. Keep in mind, though, that Chrome won’t stop at debugger statements unless DevTools is open – so make sure the developer tools are running.
Need to pause execution immediately? Press F8 (or Ctrl + \ on Windows/Linux, Cmd + \ on Mac). To disable a breakpoint, simply click the blue icon again, or right-click it and choose Remove breakpoint. You can also manage all your active breakpoints easily from the Breakpoints pane.
Once you’ve mastered the basics, you can dive into the different types of breakpoints for more targeted debugging.
Different Types of Breakpoints
Chrome DevTools offers eight types of breakpoints, each tailored for specific debugging challenges. Here’s a quick overview:
| Breakpoint Type | Purpose |
|---|---|
| Line-of-code | Stop at a specific line of code. |
| Conditional line-of-code | Pause at a line of code only when a certain condition is met. |
| Logpoint | Log a message to the Console without stopping code execution. |
| DOM | Pause when a specific DOM node or its children are modified or removed. |
| XHR | Pause when an XHR request URL matches a specific string pattern. |
| Event listener | Pause when an event (like click) is triggered. |
| Exception | Stop on a line throwing a caught or uncaught exception. |
| Function | Pause whenever a specific function is executed. |
Conditional breakpoints are especially handy for troubleshooting loops or functions that run frequently. For example, instead of pausing on every loop iteration, you can set a condition like x > 10 to stop only when the condition is true. To add one, right-click a line number, select Add conditional breakpoint, enter your condition, and hit Enter.
DOM breakpoints are a go-to when debugging dynamic web apps. In the Elements panel, right-click an element, hover over Break on, and choose from options like Subtree modifications, Attribute modifications, or Node removal. These are great for catching unexpected changes to your page structure.
XHR/fetch breakpoints are perfect for tracking down network issues. In the Sources panel, expand the XHR Breakpoints pane, click Add breakpoint, and enter a string pattern. For instance, typing api will pause execution whenever a request with "api" in the URL is made.
Event listener breakpoints help with debugging event-driven bugs. Expand the Event Listener Breakpoints pane, and select specific events like click or entire categories like Mouse or Keyboard.
Logpoints are worth highlighting because they let you send messages to the Console without interrupting execution. This is a cleaner alternative to sprinkling console.log() statements throughout your code.
Breakpoint Tips and Techniques
Once your breakpoints are set, a few strategies can help you debug more efficiently. Start by placing breakpoints at function entry points instead of deep within complex logic. This lets you see what data is coming into the function before diving into the details.
When working with loops, opt for conditional breakpoints to avoid stopping on every single iteration. For example, you could set a condition like i === 500 or item.status === 'error' to focus on specific cases.
To streamline debugging, blackbox third-party scripts so the debugger skips over library code like jQuery or React. Right-click a file in the Sources panel and choose Blackbox script to keep the focus on your code.
If certain lines cause unnecessary pauses, use the "Never pause here" option. Just right-click the line number and select it to avoid interruptions from other breakpoint types.
If your breakpoints aren’t working as expected, check that you’re debugging the correct file version, clear your cache, and make sure the Deactivate breakpoints option isn’t enabled. Forgotten debugger; statements in your code can also cause unexpected stops, so search your codebase for these if needed. As a last resort, use the Restore defaults and reload option in DevTools to reset everything.
For effective debugging, start with a broad approach by setting breakpoints at major function boundaries. Then, narrow your focus to specific problem areas. This way, you can trace the flow of data and execution without getting bogged down in unnecessary details.
sbb-itb-593149b
Debugging with the Console Panel
The Console panel is like your dashboard for JavaScript debugging, showing real-time information as your application runs. Unlike breakpoints that stop execution, the Console allows you to monitor your app’s behavior continuously without interrupting the user experience. You can log messages, track errors, and even test snippets of code on the fly. This makes it a great companion to breakpoint debugging, offering insights while your app keeps running.
Console Logging Methods
The Console provides several methods to log messages, each tailored for different purposes. The most common is console.log(), perfect for general output and inspecting variables. If you want to emphasize a message, console.info() adds an information icon, while console.warn() highlights warnings in yellow with a warning symbol to draw attention.
For more serious issues, console.error() displays messages in red with an error icon, making them easy to spot. There’s also console.debug() for detailed logs, which you can filter out when they’re not needed. These methods help you organize and filter logs by their type.
For more advanced scenarios, Chrome DevTools includes specialized methods like console.group() and console.groupEnd() for grouping related logs, and console.trace() to view stack traces. Another standout is console.table(), which formats arrays and objects into clean, sortable tables. This makes analyzing patterns or spotting anomalies in complex data much simpler.
Reading and Filtering Console Messages
Once you’ve logged messages, the Console offers tools to filter and focus on what matters most. Use the filter buttons at the top to quickly show or hide specific message types like errors, warnings, or logs.
For precise filtering, the search box is invaluable. You can type keywords to focus on relevant messages or exclude unwanted ones by adding a minus sign before the term. For instance, typing -JQMIGRATE hides all messages containing "JQMIGRATE." You can even use regular expressions for more complex filtering – just wrap your pattern in slashes, like -/^DevTools/, to exclude messages that start with "DevTools." Combine filters with spaces (e.g., -chrome-extension: -cookie) to exclude multiple types of messages at once.
To permanently hide messages from a specific file, right-click on its filename in the Console and choose "Hide messages from filename". This is especially handy for muting noisy third-party libraries while keeping your own logs visible.
If your debugging involves navigating between pages, enable "Preserve log" in the Console settings. This ensures your logs remain intact even when the page reloads or you move to a different one, preserving valuable debugging information.
Running Code in the Console
The Console isn’t just for logging – it’s also a live JavaScript interpreter. You can execute code directly in the context of your current webpage, making it easy to test fixes, inspect variables, or modify the DOM without touching your code files.
Just type any JavaScript statement into the Console and hit Enter to run it. You can access variables, call functions, test API calls, and more – all in real time. For added efficiency, the Console Utilities API offers shortcuts for common debugging tasks. For example, $0 references the currently selected DOM element in the Elements panel, while $_ retrieves the result of the last Console evaluation. You can even use copy() to send content to your clipboard or monitor() to log whenever a specific function is called.
If you find yourself repeatedly testing the same code, consider creating a snippet in the Sources panel. Go to the Snippets pane, click "New snippet", name it, and write your JavaScript code. You can run snippets by clicking the Run button or using the Command Menu – just type ! followed by the snippet’s name.
Snippets are incredibly versatile. They have full access to your page’s JavaScript context, allowing you to modify the DOM or automate repetitive tasks. Think of them as bookmarklets stored right inside DevTools, ready to simplify even the most complex debugging scenarios.
Code Execution Control and Variable Inspection
When your code execution is paused, Chrome DevTools gives you the tools to step through it, examine variables, and trace function calls. This part of debugging is all about taking control of your code’s flow and digging into runtime data, making it easier to pinpoint bugs in complex, interconnected functions.
Step Controls: Over, Into, and Out
Once you’ve paused execution, step controls help you navigate through your code with precision. These controls – Step Over, Step Into, and Step Out – appear in the Sources panel when your code hits a breakpoint.
- Step Over lets you execute the current line without diving into any function calls. This is useful when you encounter a function unrelated to your debugging focus. For instance, if you’re troubleshooting an authentication issue and hit a logging function, stepping over it keeps you on track.
- Step Into dives into function calls, pausing inside them so you can examine their inner workings. Use this when you suspect a bug is hiding within a specific function.
- Step Out finishes executing the rest of the current function and brings you back to the calling code. For example, if you’re inside a function and press Step Out, DevTools will run the remaining code and pause at the point where the function was called.
Here’s an example to illustrate:
function updateHeader() { var day = new Date().getDay(); var name = getName(); // A updateName(name); // D } function getName() { var name = app.first + ' ' + app.last; // B return name; // C } If you pause at line A and press Step Over, the getName() function (lines B and C) will execute entirely, and execution will pause at line D. If you press Step Into, DevTools will take you inside getName() and pause at line B.
Checking Variables and Call Stacks
When execution is paused, the Scope panel becomes your go-to tool for inspecting your program’s memory. It organizes variables by scope and shows their current values, making it easier to track changes.
- Local variables are specific to the current function.
- Global variables are accessible throughout your application.
- Closure variables are inherited from outer functions.
You can expand objects and arrays to explore their properties and elements in detail.
The Call Stack section provides a snapshot of the sequence of function calls that led to the current breakpoint, with the most recent call at the top. Clicking on a function in the call stack takes you directly to its code, where you can review variable values, helping you understand how data is passed around.
Watch Expressions Setup
Watch expressions let you keep an eye on specific variables or expressions as you step through your code. Whether it’s a simple variable like userName or a more complex one like users.filter(u => u.active).length, watch expressions help focus your attention where it matters.
To set up a watch expression, go to the Watch section in the Sources panel and click the plus icon. Enter the variable name or expression you want to track and press Enter. As you step through the code, the watched value updates in real time, showing you exactly how it changes.
There are several ways to add watch expressions. For instance, you can highlight code, right-click, and choose "Add selected text to watches", or use the shortcut Ctrl + Shift + A. To remove a watch expression, hover over it in the Watch panel and click the delete icon.
Watch expressions aren’t limited to simple variables. You can track any valid JavaScript expression. For example, adding typeof sum can quickly identify type mismatches, such as a string causing unexpected results. If needed, you can refresh the watch values manually by clicking the refresh button.
Summary and Next Steps
Chrome DevTools is packed with powerful debugging tools that can take your JavaScript development to the next level. Features like breakpoints and step controls let you manage code execution with precision, while tools such as variable inspection and watch expressions go far beyond the simplicity of console logging.
Using DevTools consistently not only sharpens your debugging skills but also speeds up your workflow and improves the overall quality of your code. Start small: for example, if an API call fails without a clear error message, combine the Network tab with breakpoints in your fetch handlers to pinpoint the issue. For problems with dynamic UI rendering, set breakpoints where DOM updates occur and use the Call Stack to trace what initiated the rendering process.
Once you’ve got the basics down, dive into advanced features. Workspace integration lets you edit code directly in the browser, while conditional breakpoints allow you to focus on specific scenarios. You can even blackbox library scripts to zero in on your application code. Pairing DevTools with editors like VS Code creates a smoother debugging experience, and testing fixes on real devices through platforms like BrowserStack ensures compatibility across environments. These advanced techniques can significantly enhance your workflow and the quality of your web applications.
While the Sources panel is your main hub, don’t overlook the Elements, Network, Performance, and Memory panels – they offer invaluable insights into different aspects of your application’s behavior. As Chrome DevTools continues to evolve with updates and new features, staying up to date will help you maintain an efficient and effective debugging process.
Now, it’s time to put these tools and techniques into action on real-world projects to refine your skills and streamline your development process.
FAQs
What mistakes should I avoid when using breakpoints in Chrome DevTools?
When working with breakpoints in Chrome DevTools, there are a few common pitfalls you’ll want to avoid:
- Placing breakpoints in non-executable code: Setting breakpoints in areas like comments or empty lines won’t work because the debugger can’t stop there.
- Not reloading the page after setting breakpoints: If you don’t refresh the page, your changes might not take effect, and the debugger won’t behave as expected.
- Using breakpoints in minified or transpiled code: Debugging such code can be a nightmare. Instead, make sure to use source maps to work with the original source code.
- Accidentally enabling ‘Never Pause Here’: If this option is turned on for a line, the debugger will skip over it entirely, which can lead to confusion.
Also, double-check that the debugger is correctly attached and that your code is up-to-date. Outdated code or a misconfigured debugging setup can prevent breakpoints from working altogether. Paying attention to these small details can save you a lot of time and frustration during debugging.
How can I debug issues caused by third-party scripts in Chrome DevTools without interrupting my workflow?
When you’re troubleshooting problems caused by third-party scripts, Chrome DevTools offers a couple of handy features to keep your workflow smooth. In the Sources panel, you can use the blackboxing option to temporarily exclude specific scripts. This lets you skip over third-party code during debugging, so you can focus on your own. Another option is setting conditional breakpoints, which ensures that only your code is examined, keeping external scripts out of the way. These tools make debugging more efficient and help you avoid unnecessary distractions.
How can I use the Network and Performance panels in Chrome DevTools to troubleshoot performance issues?
To address performance issues effectively, begin with the Performance panel to record your app’s runtime behavior. This tool lets you pinpoint bottlenecks, fine-tune resource usage, and evaluate rendering times. It’s a great starting point for identifying areas that need improvement.
Next, dive into the Network panel to check resource load times, monitor network requests, and detect any slow or failing resources. This step is crucial for understanding how external factors might be affecting your app’s performance.
For a more detailed analysis, consider enabling CPU throttling to simulate the performance of slower devices. This allows you to see how your app behaves under less-than-ideal conditions, helping you identify potential issues that might affect users with older or less powerful devices. Regularly monitoring these metrics can help you catch problems early and maintain a smooth experience for your users.